Skip to content

vminfoTerminal system monitor, MCP server, web dashboard, and Go library

Cross-platform host visibility from one binary — through a TUI, JSON output, browser dashboard, read-only MCP tools, or embeddable Go APIs.

vminfo

Install in one command

bash
curl -fsSL https://raw.githubusercontent.com/cloudapp3/vminfo/main/install.sh | bash

Then launch the terminal UI:

bash
vminfo

Or get a JSON snapshot for scripts:

bash
vminfo summary --json

Why vminfo

vminfo is built for developers, SREs, DevOps engineers, and server operators who need low-friction visibility into a machine.

Use it when you need to:

  • inspect CPU, memory, disk, network, load, and processes from a terminal
  • export machine-readable JSON for scripts and automation
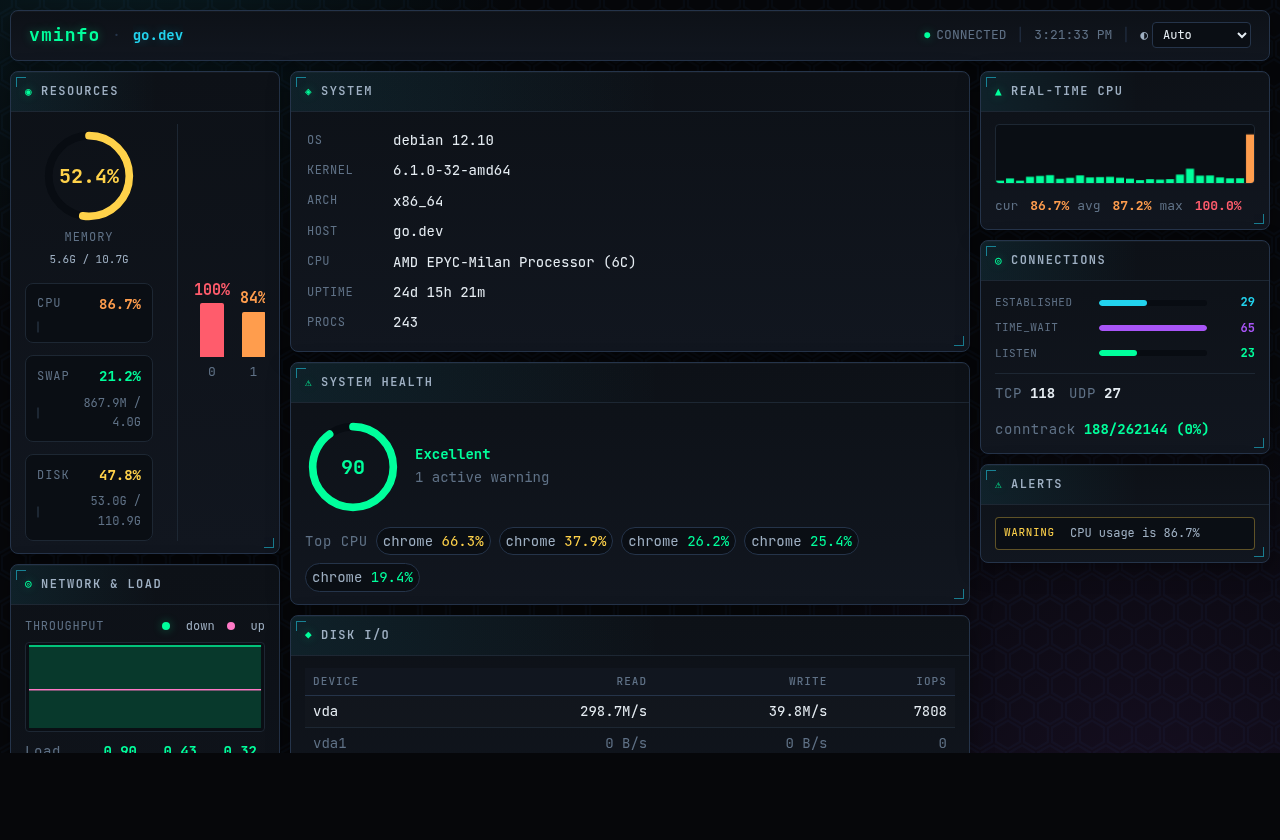
  • open a browser dashboard on a server with vminfo --web
  • let a trusted MCP client inspect the host with vminfo mcp
  • embed host metrics collection into another Go tool
  • diagnose a single host without running a full monitoring platform

Not sure which layer you need? Use the system monitoring tool comparison to decide between vminfo, btop, Glances, and gopsutil.
Compare monitoring tools

  • vminfo vs btop: terminal-first monitoring versus a broader JSON, Web/API, and Go workflow
  • vminfo vs Glances: self-contained local diagnostics versus plugins, exports, and client/server monitoring
  • vminfo vs gopsutil: a ready-to-run toolkit and high-level API versus low-level Go metric primitives

Screenshots

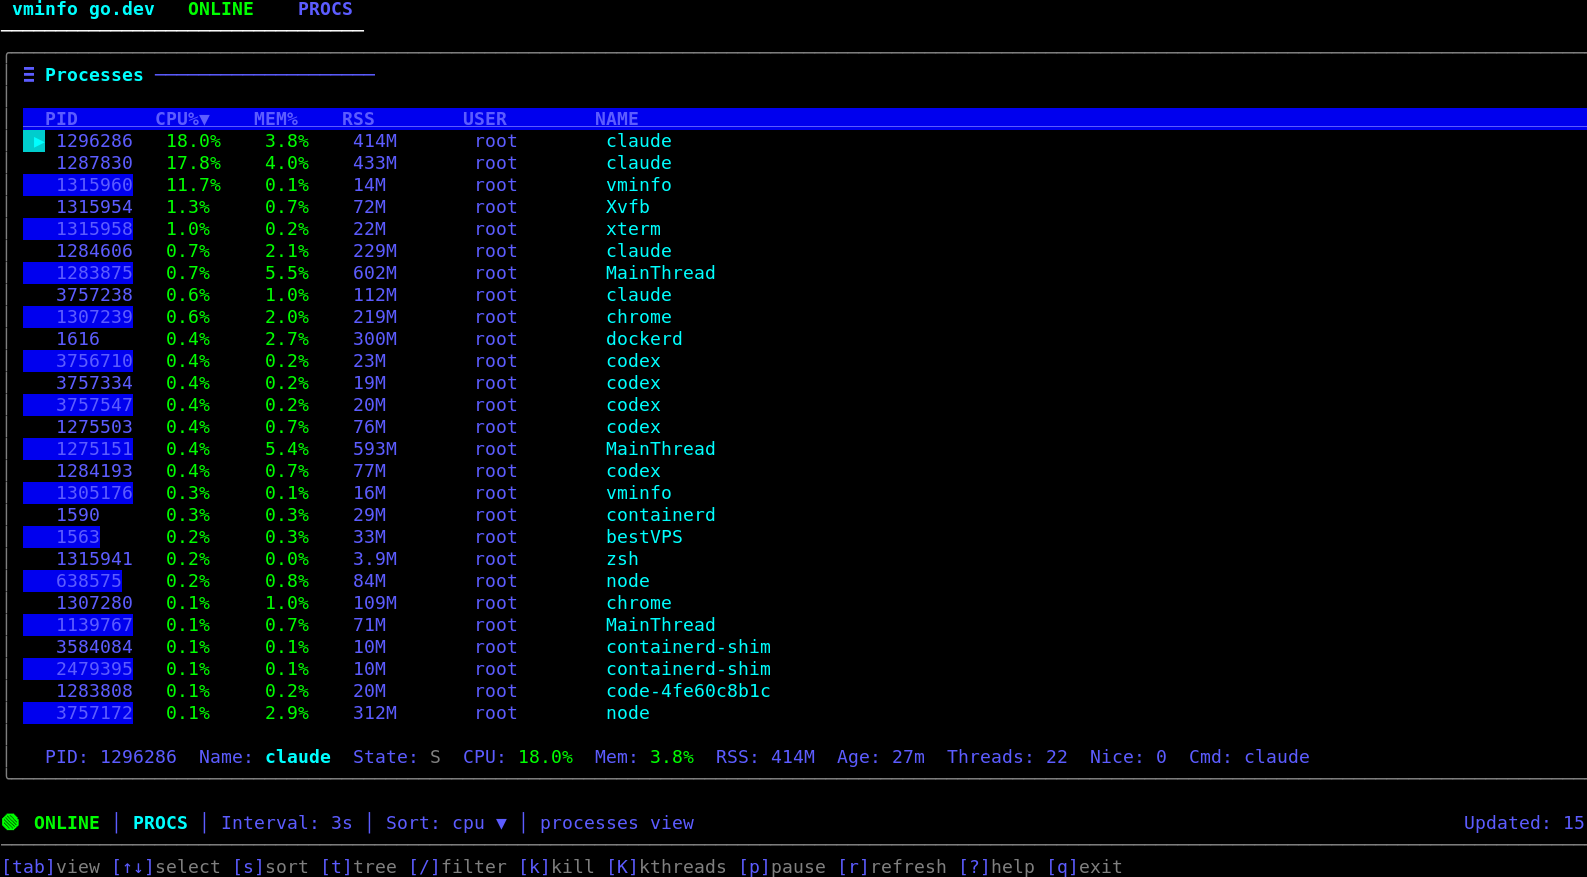
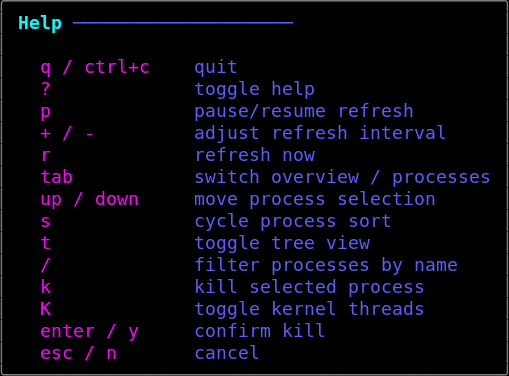
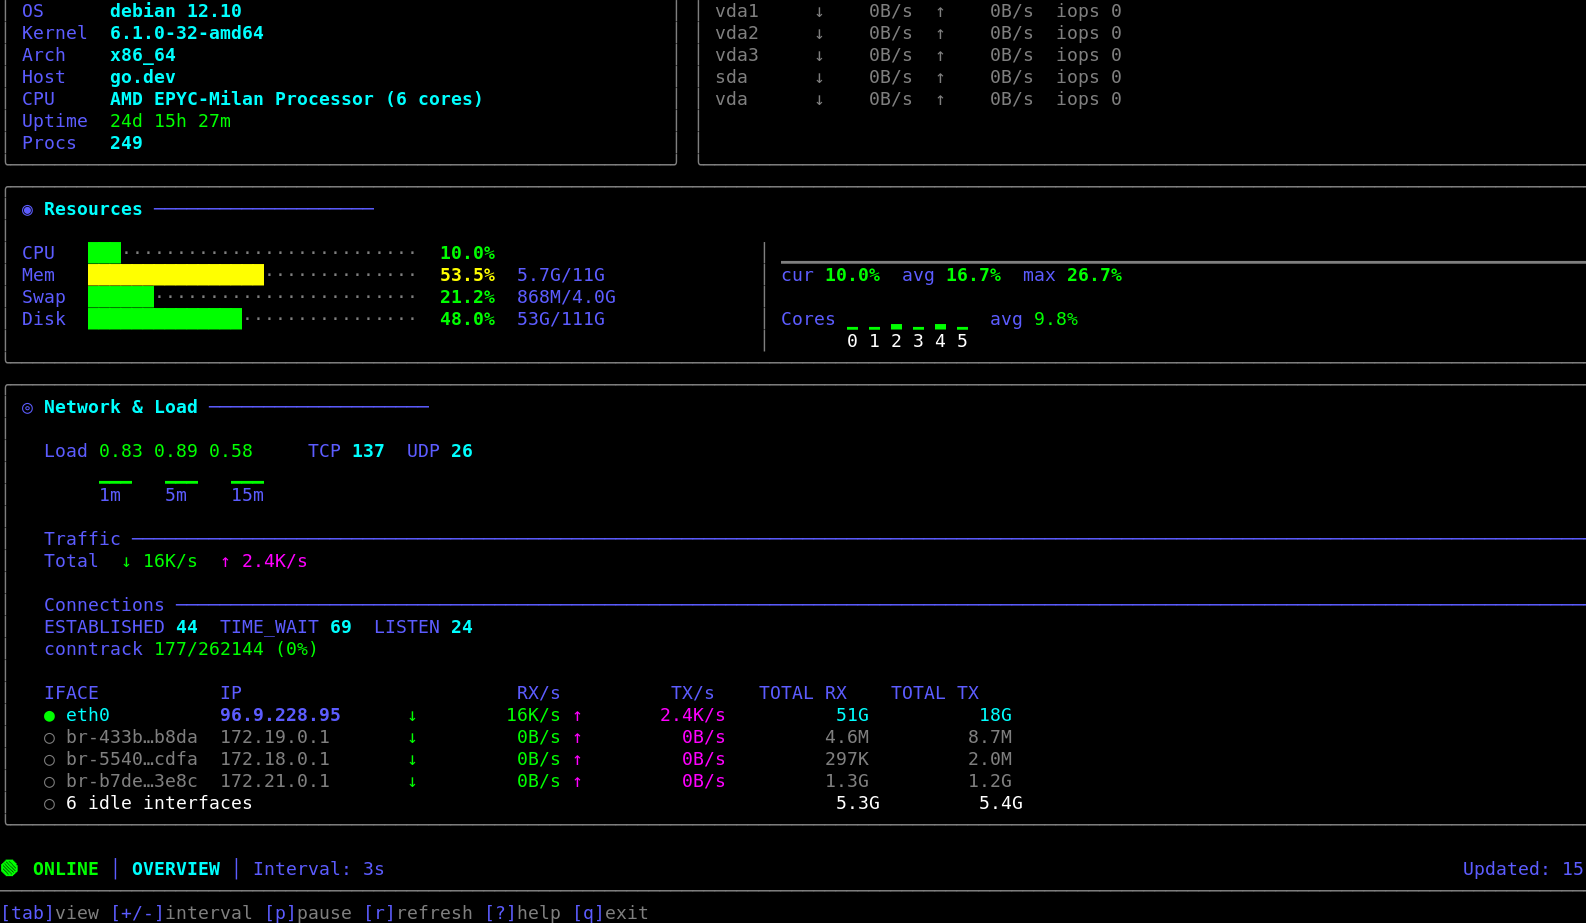
vminfo TUI overviewvminfo web dashboardvminfo process viewvminfo help overlay

Released under the MIT License.